

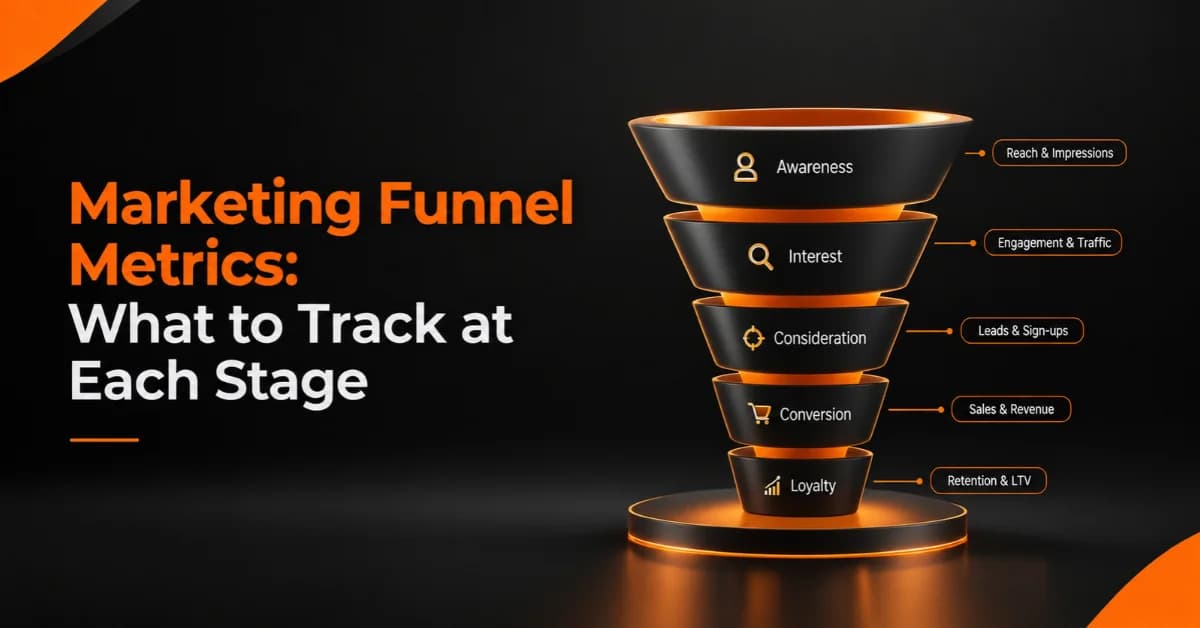
Marketing Funnel Metrics: What to Track at Each Stage
Marketing can generate plenty of traffic, clicks, and leads, but those numbers do not always tell you whether your marketing is actually working. To understand performance, businesses need to see what happens at every stage of the customer journey. That is where Marketing Funnel Metrics become useful. They help marketers measure how people move from discovering a brand to considering an offer, becoming customers, and eventually returning for more.
The right funnel KPIs can reveal where prospects lose interest, which channels generate qualified opportunities, and which activities contribute to revenue. Instead of reporting numbers in isolation, marketers can use marketing measurement to connect audience behavior with business outcomes.
What Are Marketing Funnel Metrics?
Marketing Funnel Metrics are measurements used to evaluate customer behavior throughout the marketing and sales funnel. They show how effectively a business attracts attention, generates interest, converts prospects, and retains customers.
A typical funnel includes four broad stages:
Awareness: People discover your brand or content.
Consideration: Prospects research your product or service.
Conversion: Prospects take a valuable action or become customers.
Retention: Customers return, renew, repurchase, or continue using the service.
The exact stages can vary by business. An ecommerce store may focus heavily on product views, add-to-cart activity, and purchases, while a B2B company may focus on leads, demos, opportunities, and closed deals.
Google Analytics, for example, allows businesses to build funnel explorations that visualize the steps users take and identify where users drop out of the journey.
Marketing Funnel Metrics vs. Funnel KPIs
A metric is any measurable data point. A KPI, or key performance indicator, is a metric that directly helps evaluate progress toward an important business objective.
For example, website traffic is a metric. If your objective is to increase qualified organic leads, organic traffic may become one of your funnel KPIs, but lead conversion and qualified lead volume may be more closely tied to the actual business goal.
The key is to avoid treating every number as equally important.
Why Tracking the Entire Funnel Matters
Looking only at the top of the funnel can create a misleading picture of performance.
A campaign might generate thousands of visitors but very few qualified leads. Another campaign might produce fewer visitors but generate customers with higher lifetime value.
Full-funnel measurement helps answer questions such as:
Which channels attract the right audience?
Where do prospects leave the journey?
Which campaigns generate qualified leads?
How efficiently does the business acquire customers?
Which customers generate repeat revenue?
Which funnel stage needs improvement?
The goal is not to collect more data. The goal is to understand what the data means and what action should follow.
Awareness Stage Metrics: Measure Reach and Attention
The awareness stage focuses on visibility and initial audience interaction. At this point, people may not know your business well enough to buy, so marketers need to measure whether the brand is reaching relevant audiences.
Website Traffic
Website traffic shows how many people visit your website and where those visitors come from.
Useful traffic categories include:
Organic search traffic
Paid search traffic
Social traffic
Referral traffic
Direct traffic
Email traffic
Do not evaluate traffic only by volume. A smaller number of visitors from a highly relevant audience may create more business value than a large amount of untargeted traffic.
Impressions and Reach
Impressions show how often content or advertising is displayed, while reach generally refers to the number of unique people exposed to it.
These metrics can help answer whether your campaigns are creating sufficient visibility.
However, high impressions do not automatically indicate strong marketing performance. They need to be considered alongside engagement, traffic quality, leads, and conversions.
Click-Through Rate
Click-through rate (CTR) measures how often people click after seeing a link, advertisement, search result, or other clickable element.
A low CTR can indicate that the:
Message does not match audience intent.
Offer is not compelling.
Creative needs improvement.
Targeting is too broad.
Search result does not clearly communicate value.
CTR becomes more useful when you compare it with what happens after the click.
Engagement Metrics
Depending on the channel, engagement may include:
Video views
Content interactions
Social engagement
Scroll behavior
Time spent engaging with content
Repeat visits
Engagement should support a business objective rather than become a vanity metric. A post with fewer interactions can still be valuable if it attracts highly relevant prospects.
Consideration Stage Metrics: Measure Interest and Intent
At the consideration stage, prospects have moved beyond simple awareness. They are researching solutions, comparing options, and deciding whether your business can solve their problem.
Landing Page Conversion Rate
Landing page conversion rate measures the percentage of visitors who complete the intended action.
Possible conversions include:
Requesting a quote
Booking a consultation
Downloading a resource
Signing up for a demo
Starting a free trial
Submitting a contact form
A useful landing page should make the next step clear and align its message with the visitor's intent.
Lead Generation Rate
Lead generation rate helps measure how effectively your marketing turns visitors into identifiable prospects.
But lead volume alone is not enough.
Consider the difference between:
500 low-quality leads and 100 highly relevant leads.
If the second group produces more customers and revenue, its business value may be significantly higher.
This is why marketers should also monitor qualified leads, lead sources, and lead-to-customer performance.
Content Engagement
Content can help prospects evaluate whether your business understands their needs.
Useful consideration-stage signals include:
Service page visits
Product page visits
Pricing page visits
Case study engagement
Resource downloads
Demo page visits
Return visits
These behaviors can help identify stronger buying intent.
Cost Per Lead
Cost per lead (CPL) shows how much marketing spend is required to generate a lead.
CPL = Marketing Spend ÷ Number of Leads
For example, if a campaign spends $2,000 and generates 100 leads, its CPL is $20.
However, marketers should not automatically choose the channel with the lowest CPL. A more expensive channel may generate substantially better-qualified prospects.
Conversion Stage Metrics: Measure Revenue-Driving Actions
The conversion stage connects marketing activity with measurable business outcomes. This makes it one of the most important areas of funnel measurement.
Conversion Rate
Conversion rate measures the percentage of users who complete a desired action.
Depending on the business, this could mean:
Visitor to lead
Lead to customer
Product view to purchase
Demo to customer
Cart to purchase
For example, if 1,000 people visit an ecommerce product page and 40 purchase, the conversion rate is 4%.
A conversion rate should always have a clearly defined conversion event and audience.
Customer Acquisition Cost
Customer acquisition cost (CAC) measures how much a business spends to acquire a new customer.
A simplified calculation is:
CAC = Sales and Marketing Costs ÷ New Customers
CAC becomes particularly useful when compared with customer lifetime value.
If acquisition costs continue increasing while customer value remains unchanged, the business may need to improve targeting, conversion efficiency, retention, or channel selection.
Cost Per Acquisition
Cost per acquisition (CPA) focuses on the cost of generating a completed acquisition.
CPL and CPA answer different questions:
CPL: How much does it cost to generate a lead?
CPA: How much does it cost to generate the desired acquisition?
Keeping these metrics separate helps marketers understand where prospects become customers.
Average Order Value
Average order value (AOV) measures the average amount customers spend per transaction.
AOV = Total Revenue ÷ Number of Orders
Ecommerce businesses can often improve revenue by increasing AOV through relevant bundles, cross-sells, upsells, or product combinations rather than relying only on acquiring more customers.
Return on Ad Spend
Return on ad spend (ROAS) compares attributed revenue with advertising spend.
ROAS = Attributed Revenue ÷ Advertising Spend
ROAS can help marketers evaluate advertising efficiency, but it should not be treated as a complete profitability metric. It does not automatically account for every cost involved in delivering a product or serving a customer.
Retention Stage Metrics: Measure Customer Value
A customer's journey does not necessarily end after the first purchase. Retention can significantly affect the long-term value of marketing.
Customer Retention Rate
Customer retention rate measures how effectively a business keeps customers over a defined period.
Strong retention can reduce the pressure to constantly acquire new customers.
Customer Lifetime Value
Customer lifetime value (CLV) estimates the value a customer generates over their relationship with a business.
It helps marketers think beyond the first transaction.
For example, a subscription company may accept a higher initial acquisition cost if customers typically remain subscribed for a long period.
Repeat Purchase Rate
Repeat purchase rate is particularly relevant for ecommerce and businesses with recurring buying behavior.
It helps answer a simple question:
How many customers come back and purchase again?
A strong first-purchase conversion rate combined with weak repeat purchases may indicate an opportunity in customer experience, product quality, communication, or retention marketing.
Churn Rate
Churn measures the percentage of customers or subscribers who stop using a product or service during a specific period.
It is especially important for:
SaaS companies
Subscription businesses
Membership businesses
Retainer-based services
Tracking churn alongside acquisition metrics provides a more complete view of growth.
The Most Important Marketing Funnel Metrics at a Glance
Instead of monitoring dozens of numbers, organize your reporting around the funnel stage.
Awareness
Website traffic
Reach
Impressions
CTR
Engagement
Consideration
Landing page conversion rate
Lead volume
Qualified leads
CPL
Content engagement
Conversion
Conversion rate
CPA
CAC
AOV
ROAS
Retention
Retention rate
CLV
Repeat purchase rate
Churn rate
The exact mix should depend on your business model and current objective.
How to Choose the Right Funnel KPIs for Your Business
Not every company needs the same dashboard.
Start with the business goal and work backward.
Start With the Business Objective
For example:
Brand awareness:
Focus on reach, impressions, qualified traffic, and engagement.
Lead generation:
Focus on qualified leads, CPL, landing page conversion, and lead-to-customer conversion.
Ecommerce:
Focus on conversion rate, AOV, CAC, ROAS, and repeat purchases.
SaaS:
Focus on CAC, activation, retention, CLV, and churn.
The best funnel KPIs are the ones that help you make a decision.
Connect Each KPI to a Funnel Stage
A simple framework is:
Business Goal → Funnel Stage → KPI → Action
For example:
Increase qualified leads → Consideration → Lead conversion rate → Improve landing page messaging
This approach keeps reporting connected to actual marketing work.
Avoid Vanity Metrics
Metrics such as followers, likes, impressions, or total traffic can provide useful context, but they should not automatically become your primary KPIs.
Ask whether a metric helps you understand:
Audience quality
Customer intent
Conversion
Revenue
Retention
If it does not, keep it as a supporting metric rather than the main measure of success.
How to Calculate and Interpret Marketing Funnel Metrics
Basic formulas make funnel reporting easier to standardize.
Conversion Rate = Conversions ÷ Total Visitors or Leads × 100
CTR = Clicks ÷ Impressions × 100
CPL = Marketing Spend ÷ Leads
CPA = Marketing Spend ÷ Acquisitions
CAC = Sales and Marketing Costs ÷ New Customers
ROAS = Attributed Revenue ÷ Advertising Spend
But the formula is only the starting point.
A metric becomes useful when you compare it with previous performance, business objectives, customer quality, acquisition channels, and revenue.
Marketing Measurement: Turn Funnel Data Into Decisions
Effective marketing measurement is not simply about creating reports. It is about using evidence to decide what to change.
Identify Funnel Drop-Offs
Imagine a service business has:
10,000 website visitors → 800 leads → 80 customers
The business has a 8% visitor-to-lead rate and a 10% lead-to-customer rate.
Rather than immediately increasing traffic, the team should investigate both conversion points.
If the website generates many leads but few customers, the issue may involve lead quality, sales follow-up, offer fit, pricing, or the qualification process.
Google Analytics funnel exploration can help visualize sequential user journeys and identify abandonment between steps.
Compare Channels, Not Just Campaigns
Compare performance across:
Organic search
Paid search
Social media
Email
Referral
Direct traffic
Do not stop at traffic volume. Follow users further through the funnel.
A channel that generates fewer visitors but more qualified customers may deserve closer attention than a high-volume channel with weak downstream performance.
Use Time-Based Analysis
Compare performance across meaningful periods.
Useful comparisons include:
Month over month
Quarter over quarter
Campaign period versus previous campaign
New customer cohorts
Acquisition channel performance
This helps separate genuine changes from temporary fluctuations.
Example: Using Funnel Metrics to Diagnose a Marketing Problem
Consider a fictional UAE ecommerce business that sells home products online.
The business notices:
Website traffic is increasing.
Product pages receive strong engagement.
Add-to-cart activity remains low.
Customers who reach checkout usually complete their purchases.
Instead of immediately increasing advertising spend, the marketing team could investigate the product-page experience.
Possible areas to test include:
Product descriptions
Images
Pricing presentation
Reviews
Delivery information
Product benefits
Calls to action
This example shows why full-funnel analysis matters. Increasing traffic may not solve a problem that occurs further down the customer journey.
Now consider a fictional UAE service business that receives many inquiries but few new clients.
The team could examine:
Lead source
Lead quality
Service-page messaging
Qualification criteria
Response time
Sales follow-up
Lead-to-client conversion rate
These are illustrative examples rather than actual client results.
Common Marketing Funnel Measurement Mistakes
Tracking Too Many Metrics
A dashboard with dozens of metrics can make it difficult to identify what actually matters.
Start with a small number of core KPIs and use supporting metrics for diagnosis.
Measuring Traffic Without Revenue
Traffic can show visibility, but it does not automatically show commercial impact.
Follow important visitors through subsequent funnel stages where your data allows it.
Ignoring Lead Quality
A campaign that produces inexpensive leads may appear efficient until you discover that very few leads are relevant.
Measure quality alongside quantity.
Using One KPI for Every Funnel Stage
Awareness, consideration, conversion, and retention represent different customer behaviors.
Each stage needs appropriate measurements.
Ignoring Retention
If you measure only acquisition, you may miss the long-term value generated by repeat customers.
Relying Only on Last-Click Attribution
Customers can interact with multiple channels before converting. Treat attribution as a measurement framework with limitations rather than assuming one touchpoint always explains the entire journey.
How to Build a Simple Marketing Funnel Metrics Dashboard
You do not need a complicated reporting system to get started.
Step 1: Define Your Funnel Stages
Use a structure that reflects your actual customer journey:
Awareness → Consideration → Conversion → Retention
Step 2: Select 2–4 Core KPIs Per Stage
Avoid choosing every available metric.
Choose the measurements most closely connected to your current objective.
Step 3: Set Meaningful Benchmarks
Compare performance against:
Historical results
Business targets
Campaign objectives
Relevant channel benchmarks
Step 4: Review Trends Regularly
A single data point rarely tells the whole story.
Review performance over an appropriate period and look for meaningful changes.
Step 5: Turn Insights Into Actions
Every important metric should lead to a question:
“What should we do differently because of this result?”
That question turns marketing measurement into optimization.
FAQs
What are the most important marketing funnel metrics?
The most useful metrics depend on the business and objective. Awareness commonly uses reach, traffic, and engagement; consideration uses leads and CPL; conversion uses conversion rate, CPA, CAC, and revenue; retention uses repeat purchase, CLV, retention, and churn.
What are funnel KPIs?
Funnel KPIs are the key performance indicators used to evaluate important stages of the customer journey. They help marketers connect activities such as traffic generation and lead acquisition with business outcomes.
What is the difference between conversion metrics and funnel metrics?
Conversion metrics focus on specific actions, such as completing a purchase or submitting a form. Funnel metrics can cover the broader customer journey, including awareness, consideration, conversion, and retention.
How do you measure marketing funnel performance?
Define the funnel stages, assign relevant KPIs to each stage, track users through their journey, analyze drop-offs, compare channels, and connect conversion activity with revenue and customer value.
Which metrics should an ecommerce business track?
An ecommerce business can track traffic, product-page engagement, add-to-cart rate, checkout conversion, purchase conversion rate, AOV, CAC, ROAS, and repeat purchase rate.
Which marketing metrics matter most for a small business?
Small businesses should prioritize metrics that connect directly to their current goal. For lead generation, qualified leads, CPL, conversion rate, and lead-to-customer conversion can be useful. For ecommerce, conversion rate, AOV, CAC, and repeat purchases may be more relevant.
How BrandVexo Can Help!
BrandVexo helps businesses build practical digital growth systems across digital marketing, SEO, web development, AI automation, and business solutions. Our approach focuses on measurable outcomes rather than vanity metrics, helping businesses connect their digital activities with real commercial goals.
We can support businesses with SEO, digital marketing, social media management and optimization, content strategy, web development, AI automation, and personal or business branding. Our focus is on understanding the audience, identifying the business challenge, and creating a practical strategy around the desired outcome.
Contact BrandVexo Digital Solutions:
Phone: +971 52 356 5409
Email: info@brandvexo.com
Website: www.brandvexo.com
Final Takeaway
Effective Marketing Funnel Metrics should help you understand how people move through the customer journey and where your marketing can improve. At the awareness stage, measure visibility and audience attention. At consideration, measure intent and lead quality. At conversion, focus on actions that contribute to customers and revenue. After conversion, measure retention and long-term customer value.
Disclaimer: The information in this article is provided for general educational and informational purposes only. Marketing results and recommended metrics may vary based on your business model, audience, industry, and marketing channels.
Free growth plan
Ready to grow your business?
Reading is a start — now let's build it. Tell us where you want to grow and a senior strategist will map the fastest, most profitable way to get there. Free, no obligation.
Discussion
Join the conversation
Be the first to comment. Comments are reviewed before they appear, so yours won't show up instantly — but we read every one.
Leave a comment
Keep reading
All articles Growth
Growth Marketing Strategy: A Practical Framework
Build a Growth Marketing Strategy with practical steps for acquisition, retention, growth experiments, conversion, metrics, and sustainable business growth.
 Growth
Content Marketing for B2B: From Expertise to Pipeline
Learn how Content Marketing for B2B turns expertise into demand, qualified leads, and pipeline through strategy, thought leadership, and useful content.
 Growth
Content Repurposing Strategy: One Idea, Many Channels
Build a Content Repurposing Strategy to turn one strong idea into multi-channel content, improve distribution, and get more value from every content asset.